KPIs
Voluntary Framework for Accountability (VFA)
The VFA is the principal accountability framework for community colleges with measures defined to encompass the full breadth of the community college mission and the diversity of students' goals and educational experiences.
Existing accountability measures in higher education do not adequately measure the unique mission of community colleges. For example, existing measures may exclude part-time students or non-credit career and technical students who are a key part of community colleges’ mission. In light of the inadequacy of existing measures, the VFA provides community colleges with a significantly improved ability to assess their performance, identify areas for improvement, and demonstrate their commitment to their academic mission.
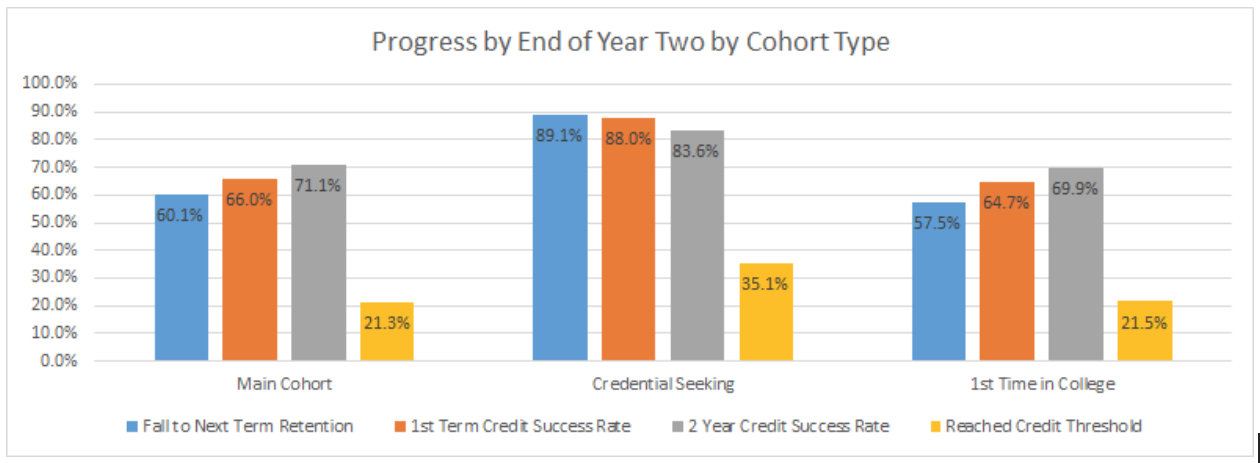
The first graph depicts four different progress metrics for each of three different cohorts of typical community college students. These cohorts are the Main Cohort and includes all of the new students entering Mid in Fall 2013. The Credential Seeking Cohort is intended to measure students who, based on their course-taking behavior, indicate that they are seeking a credential at the college. It is a subset of the Main Cohort. The First Time in College (FTIC) cohort includes students who after high school have no prior postsecondary experience before entering your institution. It is intended to parallel the Student Right-to-Know graduation rate cohort (as defined for IPEDS), but for VFA it includes full-time and part-time students. FTIC cohort is a subset of the Main Cohort. The measures are taken at the end of year two for the cohorts. (For additional information on these metrics please see this VFA brochure.)
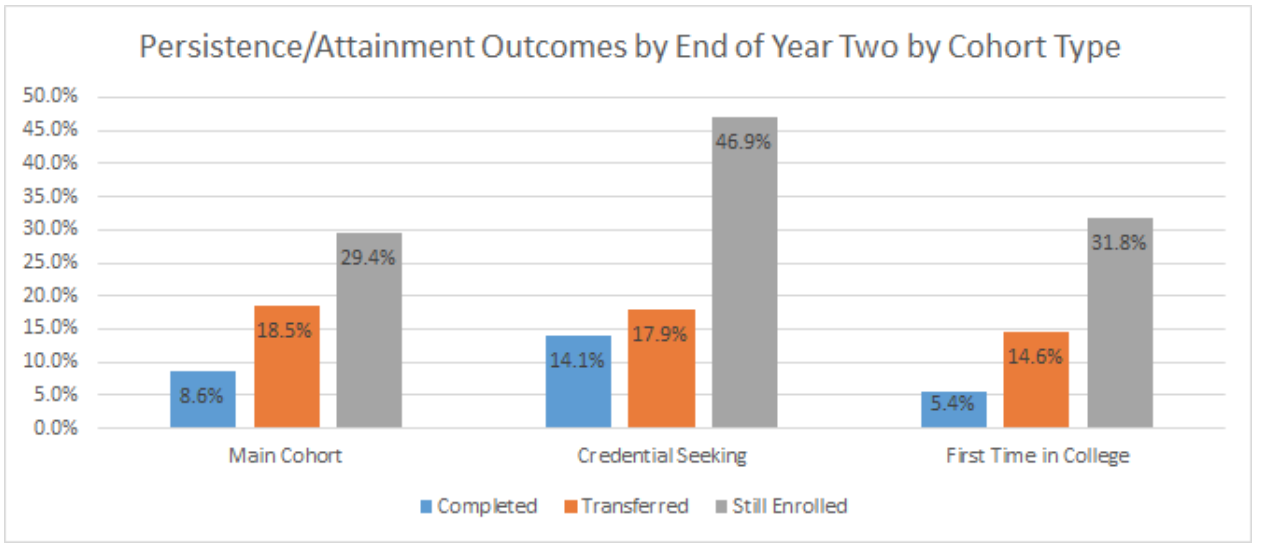
The second graph depicts three different persistence measures for the same three typical community college student cohorts. These metrics can be simply understood as asking: 1) Did the student complete their credential or degree? 2) Did they transfer to another institution? 3) Are they still enrolled?
Progress be End of Year Two
- Fall to next Term Retention
- 1st Term Credit Success
- 2 Year Credit Success Rate
- Percent Reaching Credit Threshold
Persistence/Attainment Outcomes by End of Year Two
- Percent Completed
- Percent Transferred
- Percent Still Enrolled
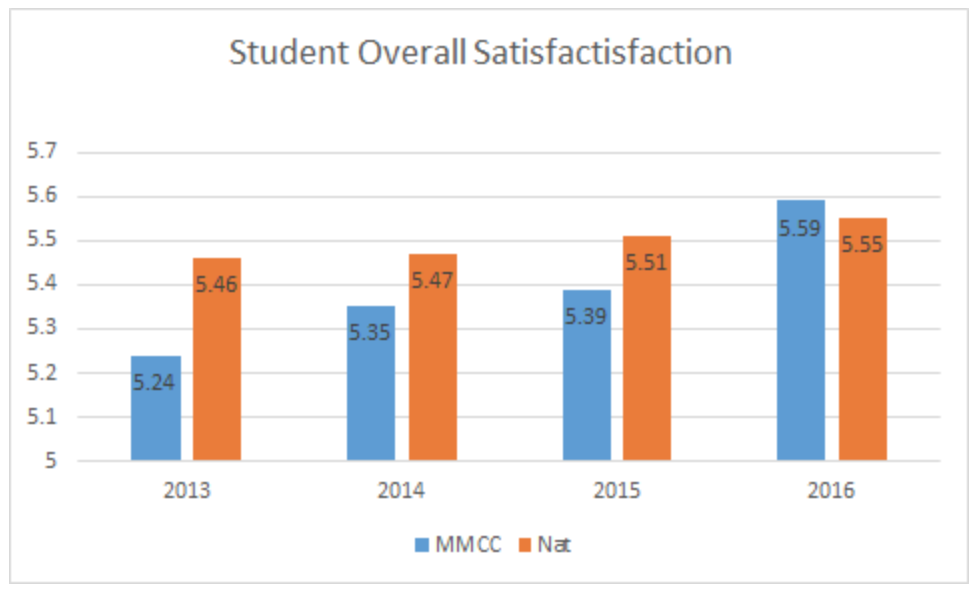
Ruffalo Noel Levitz Student Satisfaction Inventory
- Overall Student Satisfaction
This graph shows the overall student satisfaction with their experience at Mid along with comparable national data for the past four years. The satisfaction level is measured on a 7 point scale, and is taken from the Ruffalo Noel Levitz Student Satisfaction Inventory, which is a survey used by many colleges across the nation.
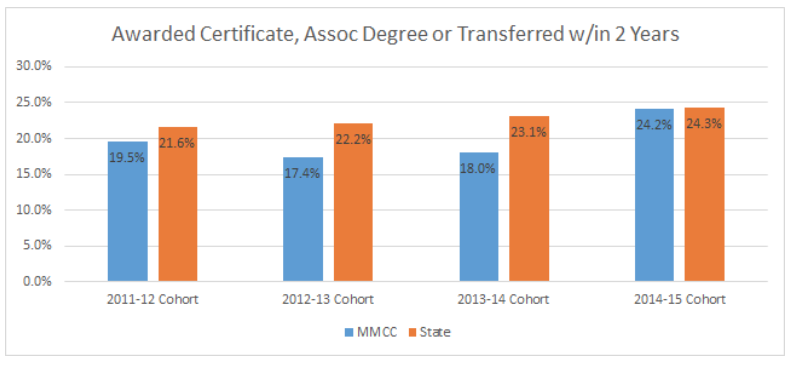
Graduation/Transfer Rates (from MI School Data)
The chart below depicts the completion/transfer rates for Mid students with comparable data from the other 27 public community colleges in Michigan. The data comes from the MI School Data website.